Introduction
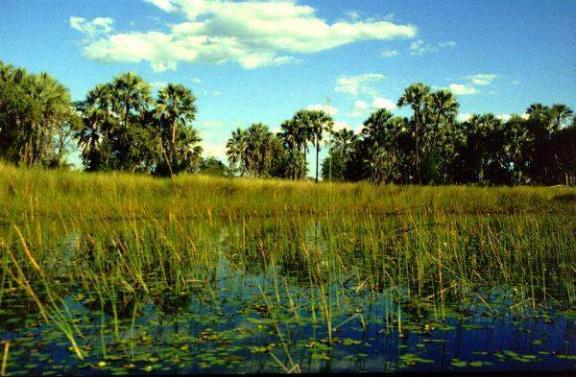
In an otherwise parched desert land, The Okavango Delta is a miracle of water, plant, and animal life;
a luxuriant network of shimmering lagoons, reed-beds, hippo pools and flood plains - home to
innumerable species. Situated in northern Botswana, The Okavango Delta is like an "oasis in the desert."
The Okavango river
Several studies have been done to examine several aspects of the Okavango Delta, particularly about the species diversity and the unique hydrology of the region. For instance, Bloem et al based their studied summarized their observations on the hydrology and geohydrology of the Okavango Delta. In the 1960s a lot of interest began to develop in the Okavango region as it is one of the only two sources of perennial water in this land-locked, semi-arid country. In addition, many similar studies have been carried out by different institutions like the University of Botswana and the United Nations, focusing mainly on the hydrology and biodiversity of the Okavango. Major water projects were formulated for the region. For example,limited dredging was carried out on the Boro channel in the Okavango area in an attempt to increase supply to the Orapa diamond mines. In 1997, the Namibian government planned to construct a waterline that will tap water from the Okavango River for irrigation and domestic uses. This sparked a lot of environmental conservation groups in Botswana to oppose the plan because it would destroy the spectacular natural beauty of this unique land that provides eighty percent of tourism income and forty percent of the nations employment. Although several hydrological models have been developed for the Okavango region, most of them have been done using the traditional way of using paper maps and other sources of data to perform the analysis. The importance of this study is that it utilizes the most recent Geographic Information Systems technology to analyze the hydrology of the delta.The initial goal of this analysis was to study the impact of the proposed Namibian pipeline on the Deltas environment and its inhabitants, and the country as a whole, but the data required for the study was not available. Hence, the analysis was limited to using the available data to determine the flow direction and flow accumulation of the delta waters. Data The data used for thgis model was obtained from several Internet sources such as GeoCommunity/Digital Chart of the World (DCW), Penn State University Map room pages, and from the Africa Data Dissemination Service (ADDS). Additional Botswana data also provided by Professor Dean Duane Nellis and Miss Zhenhuan Chi from the WVU Geology/ Geography Department. The data layers downloaded from the DCW web page include:
v the administrative or political boundaries; populated places-points and polygons v Landuse/landcover points and polygons v Hydrography; drainage points and network v Hypsography; points and network v Transportation; aeronautical-points, roads-lines, and railroads-lines v Utilities-lines v The data for the Botswana map boundaries also downloaded from the ADDS v A satellite image of the Okavango delta v The description files (Metadata) were also downloaded from the DCW to aid in the manipulation of the data. The following is a table of different themes and their associated coverage names.
The above coverages were downloaded from the Digital Chart pf the World in ".eoo" format, unzipped using WinZip, and exported to Arc View using the Import 71 Arc View program. The DCW data has the following applications: a 1: 1000,000 scale, Clark 1866 Spheroid, and the units are in decimal degrees. The Geographic Projections of the World was applied to the DCW data. The data was developed by the US Defense Mapping Agency, compiled by the Environmental Research Institute (ESRI), and distributed by Penn State University. Methodology
Three views were created by adding different themes from the above-mentioned coverages. To begin with, a map of Botswana was digitized to its location in Africa. A map layout was then made from the Africa view, and exported as a JPEG image (refer Figure 1 in the results section). A second view called Botswana was created by adding the following themes: administrative boundaries, drainage network, roads, railway lines, airports, and populated places. The drainage network theme was used to create a new shape file for the study area, the Okavango Delta. This was done by selecting all the drainage polygons that make up the delta, and converting them to a shape file using the Convert to Shapefile command from the Theme menu. Creating a separate shape file for the delta is important because the focus is to perform some hydrology operations on the Okavango delta alone. The different populated places on the map were the labeled using the Auto Label option from the Theme menu. All the themes in the Botswana view were then turned on and a layout was produced ( Figure 2).
The final view was created and named The Okavango Delta. While the other two views were
created mainly to aid in making output maps, this final view is made to limit the hydrology
operations to the Okavango delta rather than performing them on the whole country. The hypsography point coverage
(hypoint), Okavango shape file, drainage network, populated places, and the administrative
boundaries were added to the Okavango delta for the analysis. Spatial Analyst extension of Arc View
was loaded to aid in the hydrology operations. The Okavango shape file was converted to a grid
by making the shape file active, then applying the Convert to Grid option from the Theme menu.
A hill shade was also computed for the Okavango grid to give it a surface appearance. However,
this was not very helpful because the Okavango area is much flatter. The hypsography elevation points were
used to interpolate the terrain surface for the Okavango Delta. This was done by selecting the
Surface menu, and utilizing the Interpolate Grid option. The output extent was set to Same As
hypsography.Spline was used as the method of interpolation, and elevation was selected as the z-value
field. The resulting grid was then renamed as Surface of elevation. The hydrology operations in
this study are based on the assumption that there is no evapo-transpiration from the delta.
Since the hypsography theme is for the whole country, a mask had to be set so that the hydrology
operations are limited to the Okavango region alone. In this case, the no data values will be
masked out so that the analysis takes place in the areas that have data values (the Okavango
delta). Setting the mask was done in the Analysis Properties option. The following is a view of the
Okavango Delta with the main populated areas around it:  The flow direction of the delta waters was calculated by using Map Calculator from the Analysis menu.The following expression was used to identify the flow direction: [Surface from Hypsography]. FlowDirection(FALSE). This command calculates the flow direction of each cell in the surface represented by a grid. If the expression in brackets is TRUE, then all cells on the edge of the surface will flow away from the surface. If it is FALSE, then flow is calculated normally for edge cells with the edge being slightly lower than the cell (ESRI, 1999). The legend values of the resulting flow direction grid were changed from codes to actual cardinal points.That is, the codes were transformed from 1, 2, 4, 8, 16, 32, 64, and 128 to E, SE, S, SW, W, NW, N, and NE. A histogram was then made from the flow direction by making the Flow Direction theme active, and then using the histogram icon on the Arc View menu bar. This is shown in Figure 3 in the results section. A similar approach was used to calculate the flow accumulation of the water from the Okavango River. An important pre-requisite to calculating flow accumulation was to make sure the Okavango surface is checked for sinks. A sink is a cell or set of spatially connected cells whose flow direction cannot be assigned one of the eight valid values in a flow direction grid. This can occur when all neighboring cells are higher than the processing cell, or when two cells flow into each other creating a two-cell loop. Sinks are considered to have undefined flow directions and are assigned a value that is the sum of their possible directions (ESRI, 1999). To create an accurate representation of flow direction and therefore accumulated flow, it is best to use a data set free of sinks. Using the Map Calculator from the Analysis menu, the following expression was used to detect for sinks: [Flow Direction].Sink. From the resulting sink grid, the Okavango surface was found to be free of sinks. The flow accumulation was then calculated as follows: [Flow Direction].FlowAccumulation (NIL). This creates a grid of accumulated flow to each cell by accumulating the weight of all cells that flow into each down-slope cell. NIL is the weight assigned to each cell, which is one in this case. Output cells with a high flow accumulation represent areas of concentrated flow.The resulting grids were then used to draw histograms that clearly represent the flow direction and flow accumulation. Results
Two map layouts were created to show the geographic location of the study area.
Figure 1 shows the location of Botswana in Africa, and Figure 2 below is a map layout showing the Okavango Delta in Botswana.
Included in this layout is a labeled map of Africa which shows the position of Botswana in relation to Namibia and Angola where the Okavango River originates. This map shows that Namibia borders Botswana on the east and Angola in the northwest. Two histograms that show the flow direction and flow accumulation results are illustrated in Figure 3. An aerial photograph of the Okavango Delta was also downloaded from the Space Shuttle Earth Observation Photography web page and is shown in plate 1. The dark broom-shaped area of this photograph indicates where the denser vegetation is found in the Okavango Inland Delta (SSEOP, 1999). The Histogram of Flow Direction shows that most of the water from the Okavango river flows mainly to the South East. The highest accumulation is in the central part of the delta whereas the lowest accumulation is in the central part of the delta. Conclusion The goal of this study was to use the Arc View GIS capabilities to model the flow-direction and flow-accumulation of the Okavango delta. The flow direction and accumulation results obtained can be utilized by resource managers and the government to make intelligent decisions on any operations performed or planned on the Okavango Delta. From this study, it is evident that the application of GIS makes it much easier to perform spatial operations that may otherwise be very cumbersome without the use of GIS. However, the study may have been much more elaborative if there were no data problems. Some of the results obtained are not very accurate because of limitations to data. Penn State University Maproom disclaims any errors in the data because they provide the data as is since they are only responsible for the distribution. Further research on the Okavango delta is highly recommended because it is one of a kind in the whole world. Because the Okavango delta is situated in a desert climate, earth scientists have deemed this site to be one of the most ecologically sensitive areas on the planet. This sensitivity is heightened by the constant competition for specific land use among would-be users of the land, including wild animals, arable and pastoral farmers, and those who wish to establish it as a natural game preserve. References Africa Data Dissemination Service. 1999. http://edcintl.cr.usgs.gov/bin/ftpadds/a=admn/b=bc Africa net. 1997. http://www.africanet.com/africanet/country/botswana/home.htm African Travel gateway. 1999. http://africantravel.com/botoka.html Botswana Government Pages. 1999. Tourism. Online Electronic Database. http://www.gov.bw/home.html Botswana Online. 1999. http://www.botswana-online.com/onlinemain.htm Botswana - wilderness areas and national parks. http://www.ecoafrica.com/africa/south/btsw/btsw.htm Delta 2000 Project. 1999. The Miracle. http://www.stud.ntnu.no/~skjetnep/owls_2000.html Digital Chart of the World DCW. DCW Map Interface for Africa. 1999. http://www.maproom.psu.edu/cgi-bin/dcw/dcwarea.cgi?Africa Geo Community. 1999. Botswana data. . http://www.gisdatadepot.com Okavango Wildlife Society. 1999. Okavango data. http://http://www.stud.ntnu.no/~skjetnep/owls.html Space Shuttle Earth Observation Photography. 1999. Botswana Okavango Swamp. http://earthrise.sdsc.edu/cgi-bin/er/quick?r=152148&15297 |


